Daily Antarctic Sea Ice Area Anomaly (Today)

In 2023-2024, the Antarctic Sea Ice Area Extent fell below the 1980 and 2016 low points in the 43 year record, which began in 1978 with the advent of new satellite technologies. In mid 2022, a new low record was reached. Despite this, per NASA in June 2021 - "in the Antarctic the sea ice coverage has been increasing although at a lesser rate than the decreases in the Arctic.".
The National Snow and Ice Data Center chart on the right shows a steady sea ice downward trend over the available data from 1980. There were 3 years starting in 2012 with rapid rises immediately followed by 3 with rapid declines bringing the extent to slightly below that of 1985.
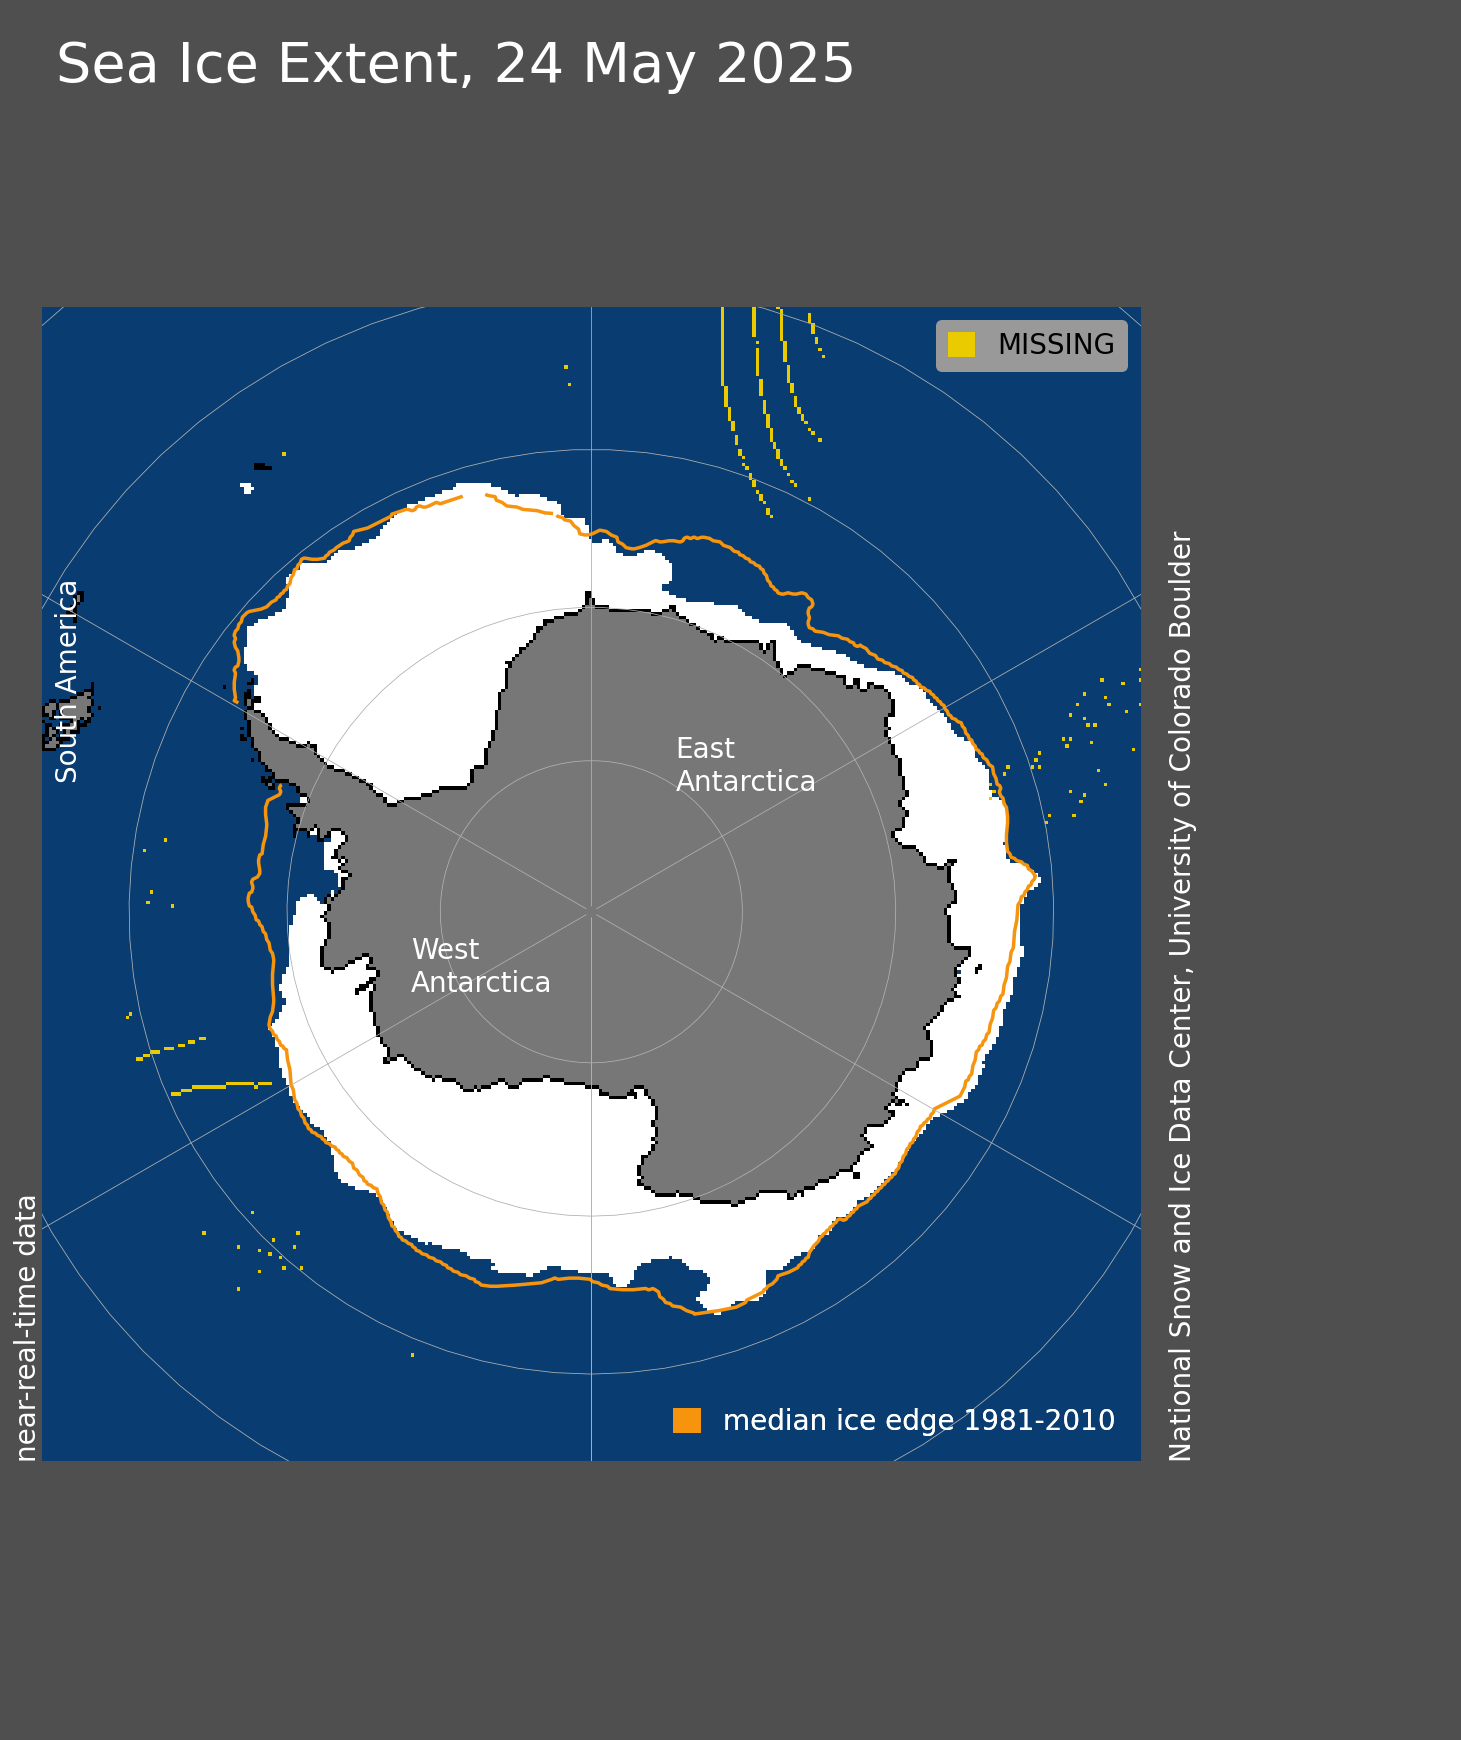
The National Snow and Ice Data Center shows a map-based view. After reaching its maximum extent unusually early and then following a period of relatively unchanging overall extent, Antarctic sea ice extent started to  decline in earnest in mid 2016 and then fully recovered by late 2020, and falling in 2022. The longer term trend line shows a 1% rise per decade in ice extent over all available data (since 1979). Both of these figures are from the Center. The chart on the left shows 2023 and 2024 at a very low level.
Analysis: Conventional wisdom (and the IPCC) states that the poles will warm first. But there has been less change in the Antarctic and it is increasing in winter. What does this tell us? The Antarctic alone cannot be used as an indicator of warming or cooling, because it must be viewed in concert with the Arctic. Also, data only goes back to 1979, when satellite sensors and analytical programs could get a handle on measuring sea ice. Even today it has problems, such as dealing with water on ice, as happens after a warm spell. The sensor sees water, not ice, but this does not mean the underlying ice is gone. If the Antarctic gains or loses ice, but the global balance is about the same, there is no global cooling or warming. Even though the Arctic nearly regains all sea ice area during each winter, there is so much loss during the summer that the new ice is thin and gives way more and more rapidly to the first sunlight of each summer. This, in turn, makes more darker surfaces, whether from exposed earth or ocean water or the melt water itself - all of which are more able to absorb, and not reflect, the heat of the sun.
More importantly, we must wonder what the satellites would have observed happening in the Antarctic when Roald Amundsen sailed through the Arctic in 1903-1905 on the small wooden ship Gjøa when the Northwest Passage was open to sailing vessels, and again in 1940-42 and 1944 (St. Roch), it is possible the reduction in Arctic ice is not an indicator of warming, since it was balanced by record high Antarctic ice levels up until a few years ago and a rising trend line for the data set since 1979. The return of Arctic sea ice to near normal levels each winter and Antarctica remaining generally above the average has received little attention. In a 2023 Antarctic summer trip to the Antrarctic peninsula and adjacent islands. I was surprized by the darkness of the ice - from atmospheric soot, bird and seal droppings and dark green and purple algae within the ice. It is not pristine anymore. Is this an unexpected consequence of rebuilding the Southern Ocean krill and fisheries resources? Namely, a darkening of the ice, causing it to melt more extensively during the summer months.