Latest Sea Level Rise Amount and Rate Information
Context: sea level has been rising off and on since the end of the last glaciation. The current rate is 3.3 mm per year, a rate than can threaten infrastructure and coastal communities. Local apparent SLR is highly varied because the Earth's surface moves vertically, sometimes far more than the sea rises. This can be due to local land subsidence due to oil or water extraction or upstream water diversions, because of rebound from the last glaciation (Maine rises causing Florida to lower because they are on the same plate), or because the Earth's crust is in perpetual motion. Some areas are experiencing triple or more the global average while others are seeing over 5 times as much in sea level fall as their part of the Earth's surface is rising. The plaque on the right can befound in the Everglades National Park. For a good view of current information see NOAA Tides and Currents (Source for Chart: Sea Level Change at the University of Colorado) Source (with permission) for Plaque: OceansArt.US. There has been minor acceleration in the rate of SLR, of about 0.1 mm/yr, which is one of two factors considered by this author, since he told his (co-chaired with Alla Tsyban (Russia/USSR)) IPCC Working Group on Oceans and Coastal Zones in Moscow in 1988 to be necessary evidence of global warming. The other is loss of global sea ice. Per a recent paper by Fasullo et al, "In stark contrast to this expectation however, current altimeter products show the rate of sea level rise to have decreased from the first to second decades of the altimeter era." There was no acceleration 30 years ago and now there appears to be a slowing according to Fasullo and a slight quickenig in the Colorado data shown here.
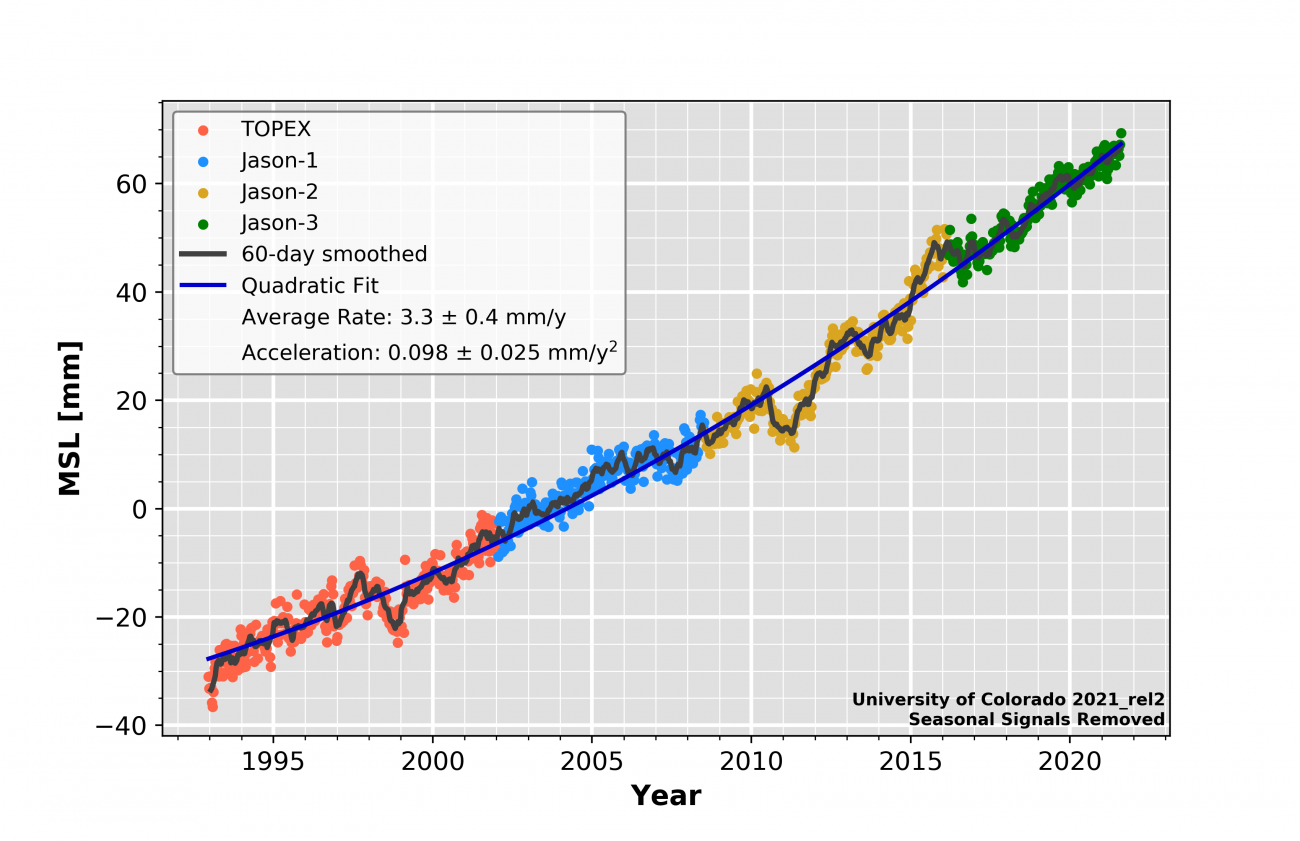
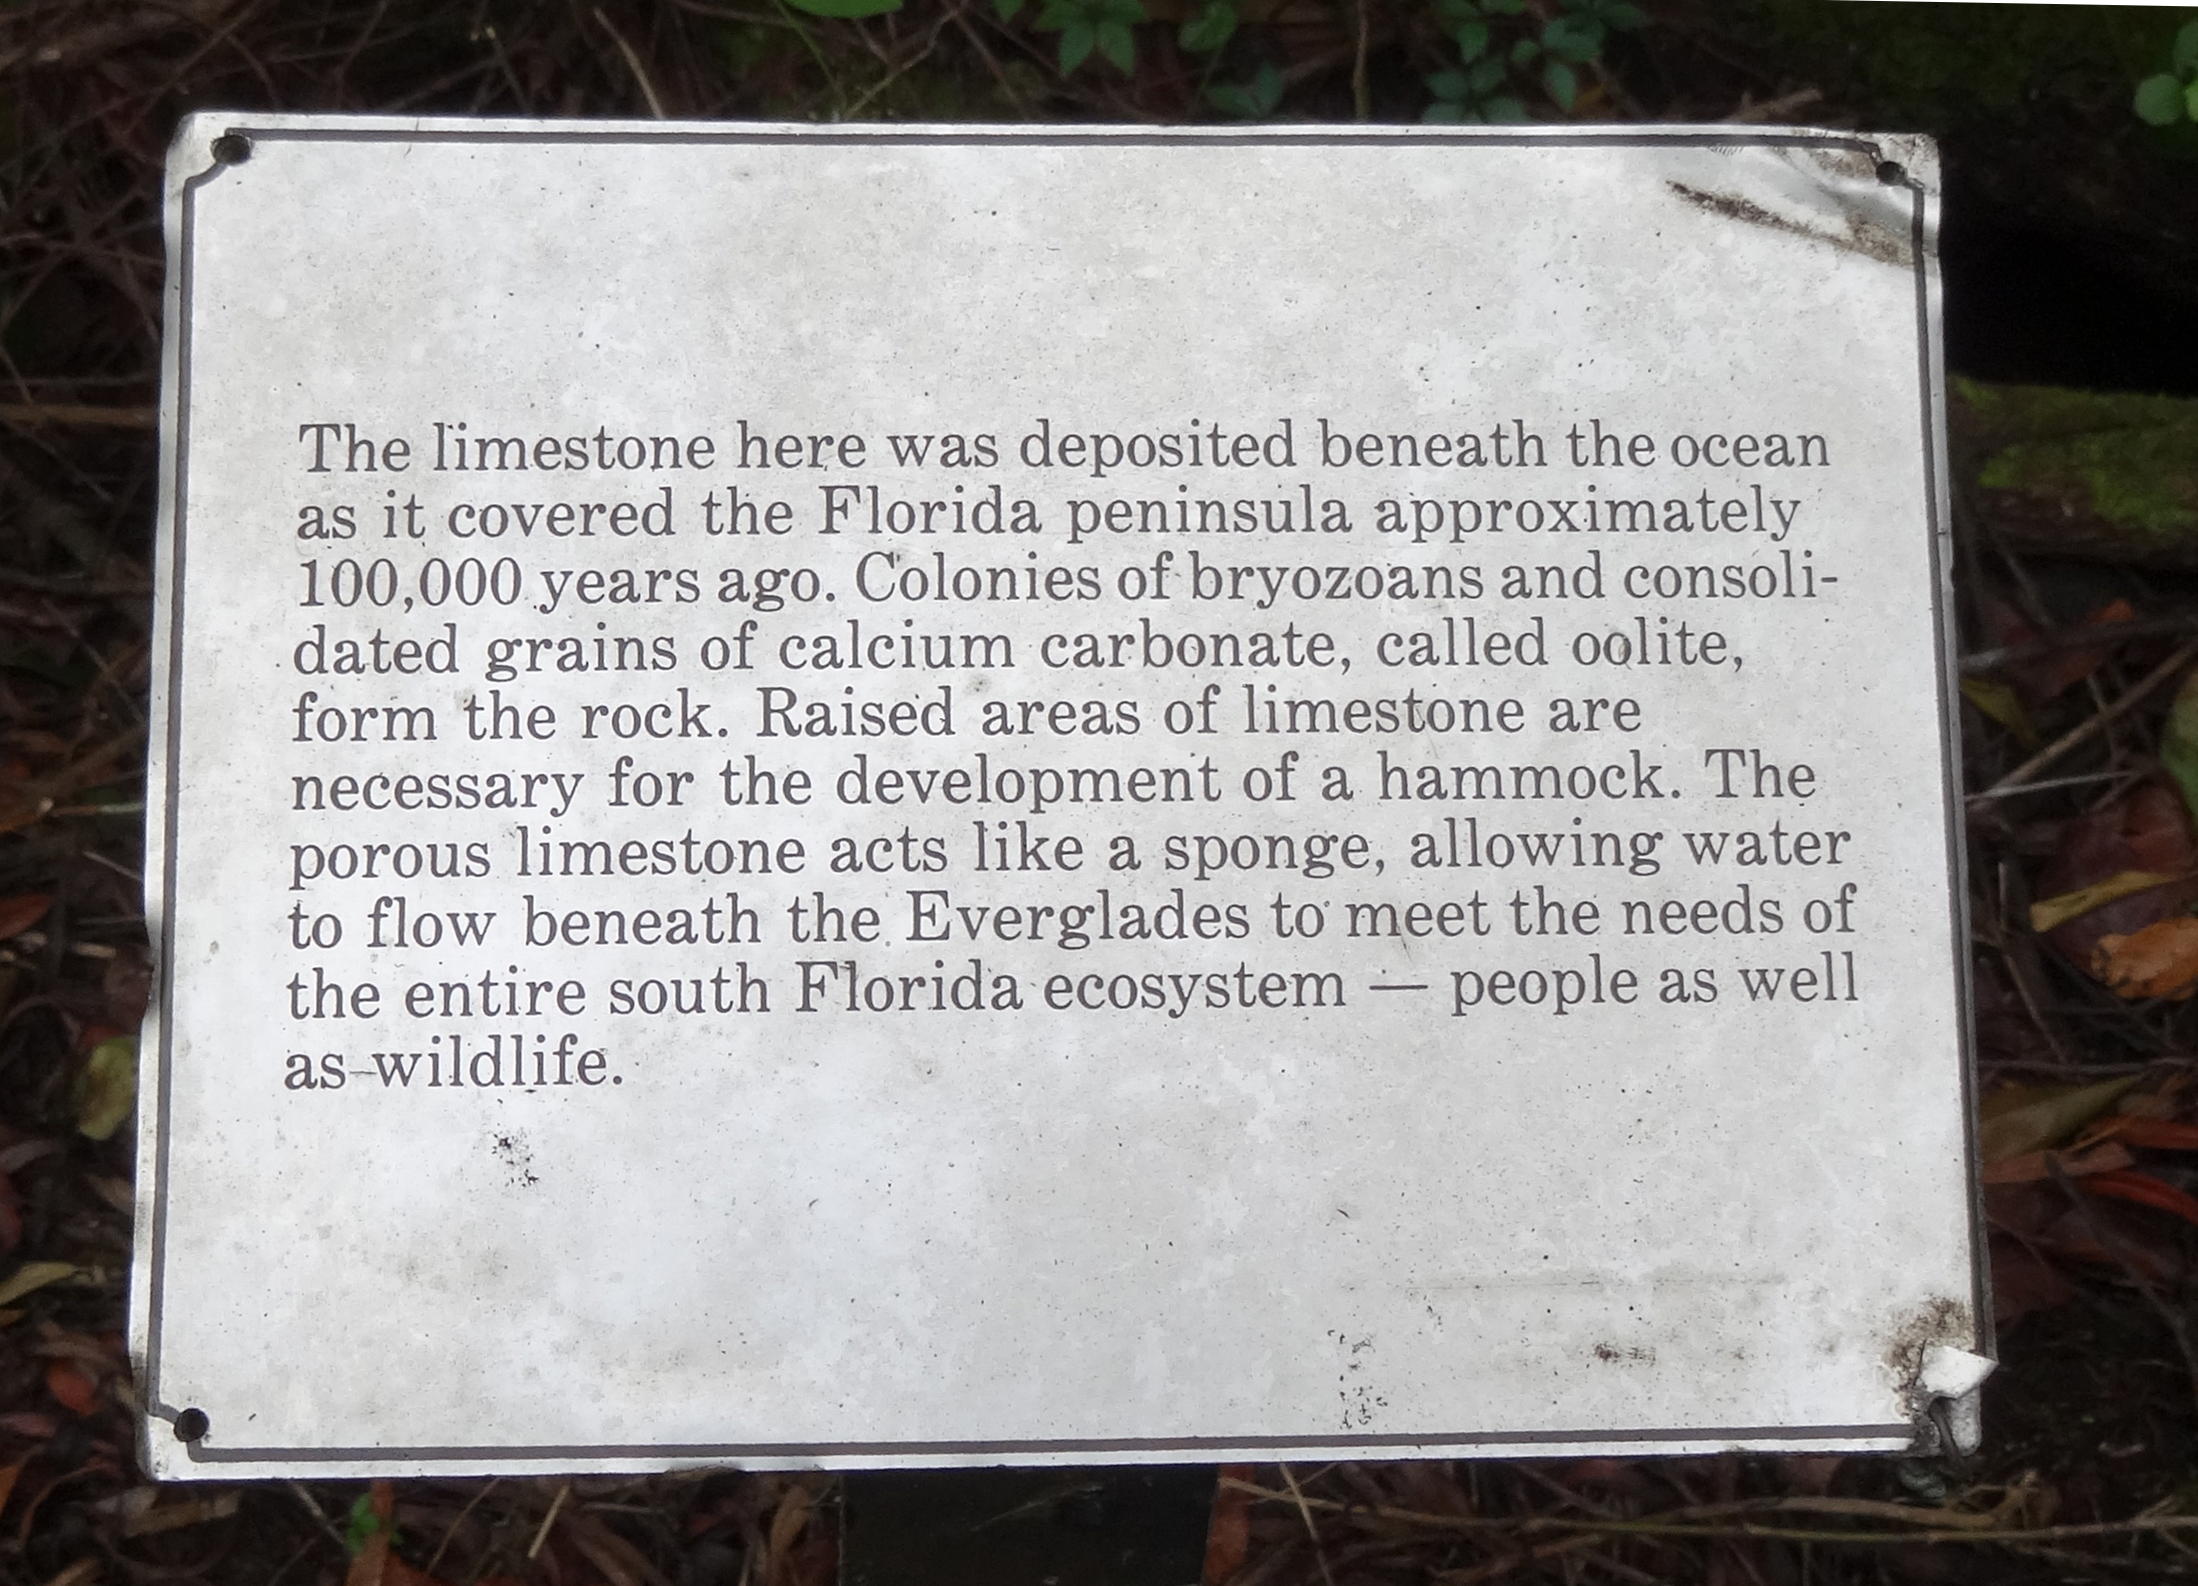
Analysis: Sea level rise or fall can be an indicator of warming or cooling, but the sea has been rising since the last i glciation ended, less than 10 thousand years ago. In the prior inter-glacial period about 125,000 years ago, there was no summer ice at the North Pole and the sea level was over 15 feet (5m) higher than today. Per the National Park Service plaque above, the Florida peninsula was underwater. If our interglacial period (The Holocene) continues, with or without further warming, we might see the same levels. The most important indicator is an acceleration in the rate of change, which would be required if there were any real warming. Most scientists do not see an acceleration. Let us remember that American Indians walked to Nantucket Island and Martha's Vineyard and they probably lived on Georges bank, where tree trunks are still caught by fishing trawlers. When you tow a scallop dredge on Georges Bank you get pieces of trees and the oysters some 70 miles off New York City appear like they were shucked yesterday when they are caught in the hydraulic clam dredge at 200 feet down. And normally they don't grow beyond 10 or so feet deep. Some few thousand years ago, Buzzards Bay was a pasture. Nantucket became an island when rising sea levels re-flooded Buzzards Bay about 5,0006,000 years ago. [Ref: Robert N. Oldale, Cape Cod, Martha's Vineyard & Nantucket: The Geologic Story, 2001.] 3mm/year will do that to you when it goes on for 8,000 years (up to 14,000 if you count the false starts at the beginning of this era). In a 2009 study, the authors used GPS measurement to correct for local vertical movement of the Earth at key tide gages, finding a "global rate of geocentric sea level rise of 1.61 ± 0.19mm/yr over the past century". Their study shows no acceleration and no changes in rate during warm or cold periods of the last 110 years. It is virtually a straight-line rate of increase, independent of Earth's temperature.